Skip to content

The Postsale Dashboard: From Insight to Action, All in One View

Use the Postsale Dashboard to visualize shipping and sales activity with flexible widgets, date filters, and charts that surface actionable insights.

Updated January 15, 20263 min readAnalytics

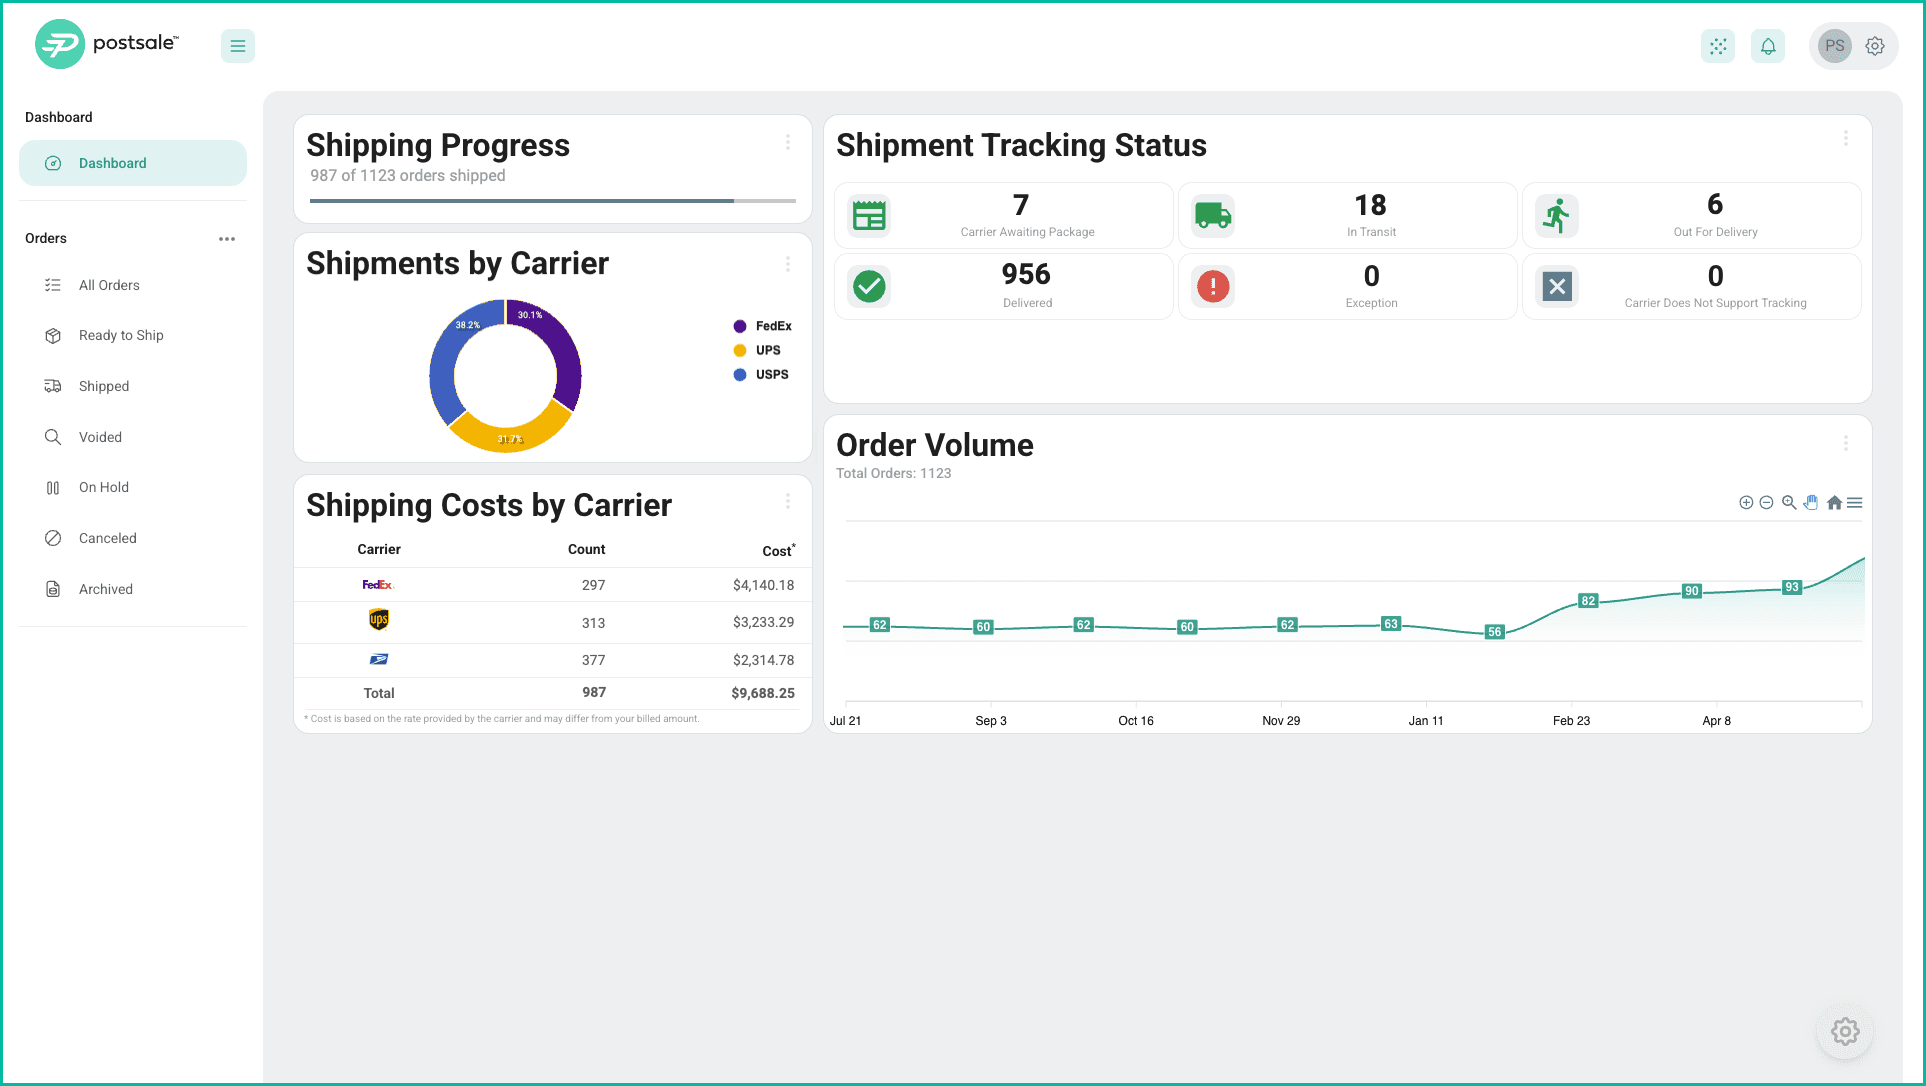
The Postsale Dashboard helps you visualize what matters most by giving clear, actionable insights into your shipping and sales activity at a glance. With flexible, customizable widgets, the Dashboard lets you monitor key metrics and trends, so you can focus on what drives your business forward. 

In this article, we’ll explore the available Dashboard widgets and show you how to tailor the view to fit your workflow.

Real-World Example

I want a single view in Postsale where I can monitor shipments, track their status, and spot trends at a glance. I’d like to see details such as shipments by carrier, shipping costs, sales totals, and more.

You can do that with the Postsale Dashboard!

Postsale Dashboard overview showing multiple widgets and shipping data

This section provides an overview of each available Dashboard widget, including:

  • How the widget evaluates and presents data
  • Customizable widget options and settings

By default, all widgets use the All Orders filter, which excludes archived orders.

Select the tab for the widget you wish to view.

Order Volume widget displaying order count over time as a bar chart

Description

The Order Volume widget displays the total number of orders in Postsale over time.

You can group the data by day, week, month, quarter, or year, and apply a saved filter to focus on a specific set of orders. 

The data includes orders that were:

  • Entered manually
  • Imported via CSV
  • Received through webhooks
  • Synced from connected platforms

Use the built-in tools to identify trends, zoom into specific time periods, or export the data as an image or CSV.

Available Settings

  • Title: Customize the title shown at the top of the widget.

  • Interval: Choose how the order data is grouped by day, week, month, quarter, or year.

  • Filter: Select a saved filter to limit the results to matching orders.

    Order Volume widget settings with Title, Interval, and Filter options
     

Widget Tools

Use the tools available in the widget toolbar to:

  • Zoom in or Zoom out to view more or fewer dates on the timeline.


  • Select an area in the timeline to zoom in on the selected date range.

    Animated demo of selecting a date range to zoom into the Order Volume timeline
     

  • Pan the timeline left or right.

    Animated demo of panning the Order Volume timeline left and right
     

  • Reset the timeline back to its original view.


  • Download the timeline view to an image file (PNG), a vector graphic file (SVG), or export the data on the timeline to a comma separated value file (CSV). 


The Postsale dashboard is available on all plans. See features for a full platform overview, or visit pricing to get started.